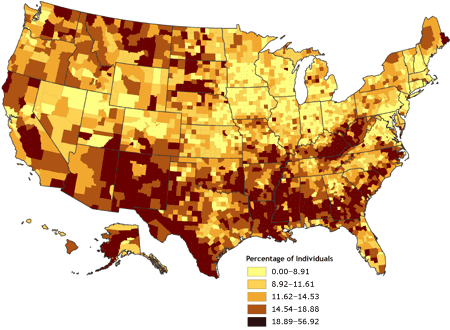
A bivariate map displays two variables on a single map by combining two different sets of graphic colors. This shows two different information at the same time. This isa gif animation that shows the two.
This map shows hazaderous waste. Unstandarizied Choropleth maps are maps where the data has not been averaged. The data is presented in numerical values.